Aggregate Flop Reports – Seeing the Bigger Strategic Picture
Discover how Aggregate Flop Reports help you understand strategy beyond individual boards.

When you want to improve your poker skills and build a profitable strategy, studying solver outputs is one of the most effective methods available. However, drawing the right conclusions requires looking beyond individual boards and understanding the bigger picture.
A strategy that works on one flop may change significantly after a small change in board texture. This is similar to the impact ranges can have on solver outputs: seemingly small differences can often produce very different optimal strategies. Focusing on individual examples alone can therefore lead to misleading conclusions.
This is why, whenever we discuss strategic concepts on our blog, we often rely on Aggregate Flop Reports. In our opinion, they are one of the most effective tools for understanding how a spot should be approached overall.
What Are Aggregate Flop Reports?
Whenever you solve a spot in Deepsolver, you can approach it in two different ways.
The first option is a traditional custom solution. In this case, you analyze one specific board and receive a complete breakdown of the optimal strategy for that exact situation.
The second option is Aggregate Flop Reports. Instead of focusing on a single board, you solve an entire set of flops simultaneously. This allows you to see not only what the optimal play is on one board, but also how strategies change across different board textures and which patterns remain consistent.
The setup process is largely the same in both cases. You begin by selecting the positions, stack depth, and preflop ranges. The difference comes in the postflop settings.
With Aggregate Reports, you do not choose one flop to solve. Instead, you select a representative set of flops.
You can choose between two report types.
Mixed reports include either 32, 60, or 114 flops that collectively represent the full spectrum of board textures. They are particularly useful when your goal is to understand a spot at a high level and identify broad strategic patterns.
Specific reports focus on selected flop categories: Monotone, Straight, Paired, Ace High, BBL, BLL, and LLL.
Here, B stands for cards Ten or higher, while L represents cards Nine or lower.
Looking for something more specific? You can also include any flop you would like to analyze alongside the selected categories.
The final step is defining the decision tree. Deepsolver allows you to use up to five different bet sizes. In practice, however, one or two sizes are often enough to capture the most important strategic ideas while producing solutions that are easier to implement in real games.
Once the setup is complete, you can run the report and start exploring how strategies evolve across different flops.
How to Use Aggregate Reports
Let us look at a practical example.
Suppose you want to study a single-raised pot between the Button and the Big Blind in a 100 BB cash game. A few useful questions immediately come to mind:
- Should the Big Blind ever have a leading strategy?
- Which c-bet sizing does the Button prefer?
- How should the Big Blind respond both to the GTO c-betting strategy and to simplified strategies that are more common in real games?
For our example let’s stick with the default preflop ranges for the Big Blind and the Button provided in Deepsolver (feel free to adjust them to better represent what you see in your games).
Let’s run an Aggregate Report for this exact spot using the largest default set of boards — 114 flops.
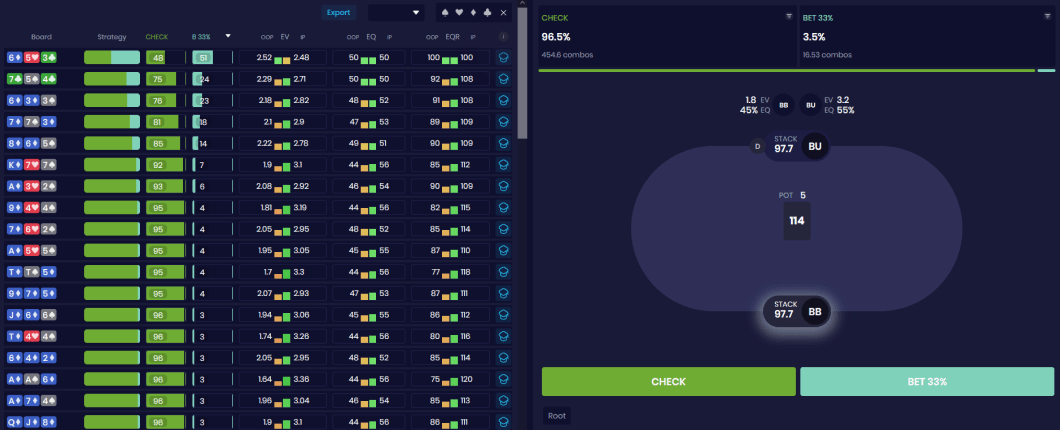
Firstly, let’s allow the OOP player to lead for one-third of the pot to see whether leading is a viable strategy in this scenario.
As it turns out, the Big Blind should have a small leading range, accounting for around 3.5% of all situations. It is reserved for specific board textures, primarily low paired boards and low connected boards where straights are possible.
If you want, you can explore the topic further by rerunning the report with additional sizing options or by focusing on particular board categories. However, many players prefer to stick to a pure checking strategy for simplicity, which is perfectly reasonable given how infrequently leading occurs.
If you'd prefer your overall strategy to always check to the preflop raiser, you can account for that in the simulations by forcing the solver to use a 100% checking strategy. For the sake of accuracy, this is exactly what we did.
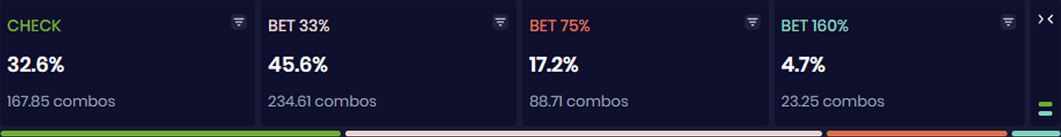
After running another report, this time with the OOP player always checking, we can turn our attention to the in-position strategy. Given the option to use several bet sizes — in our case, one-third pot, three-quarters pot, and a 160% pot overbet (although you can use up to five sizes) — Deepsolver favors the one-third-pot bet, choosing it roughly 45% of the time.
Furthermore, with just one click, you can rank flops by their preferred sizing and quickly identify the board textures where a particular sizing is most commonly used. In our example, that sizing is the one-third-pot bet.
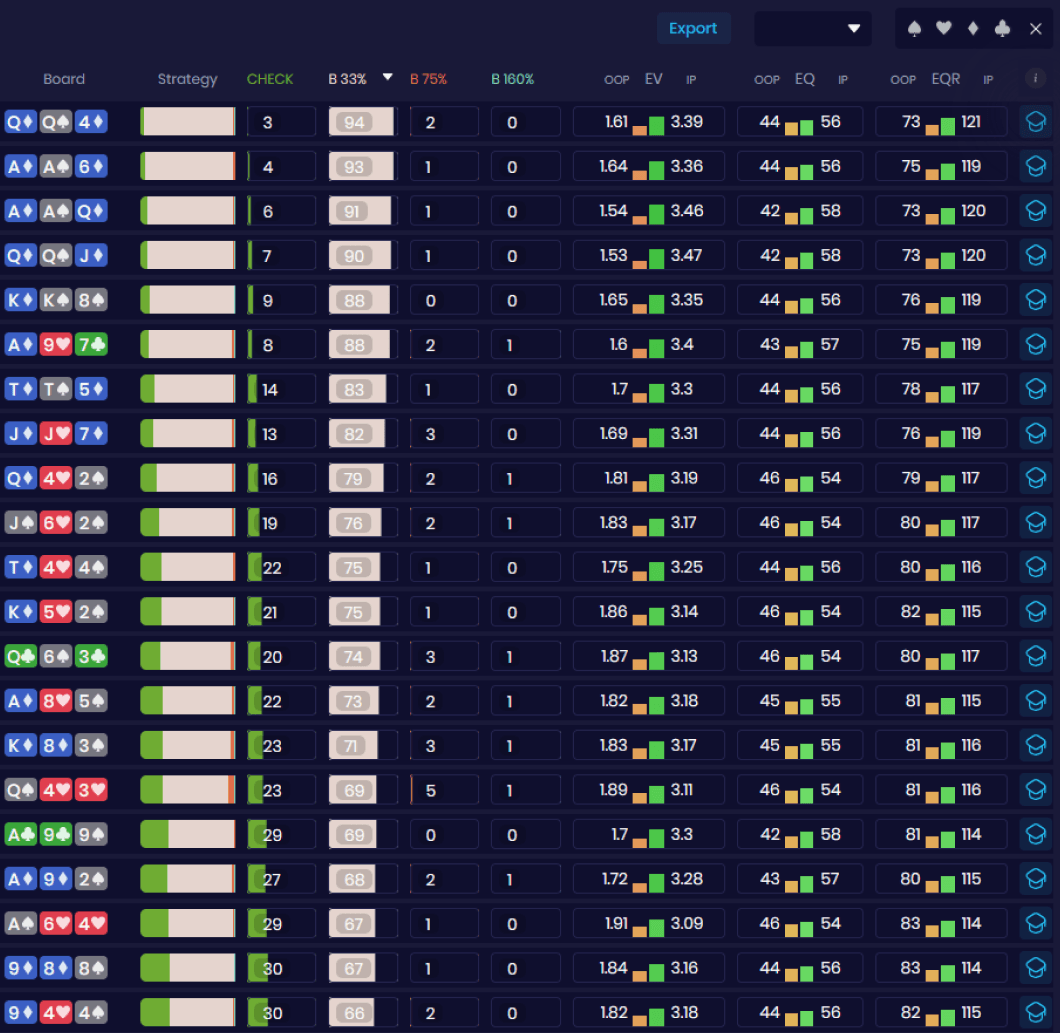
It turns out that a one-third-pot bet is a viable strategy on the majority of boards. It is particularly preferred on boards with paired high cards and on disconnected boards containing one high card and two low cards.
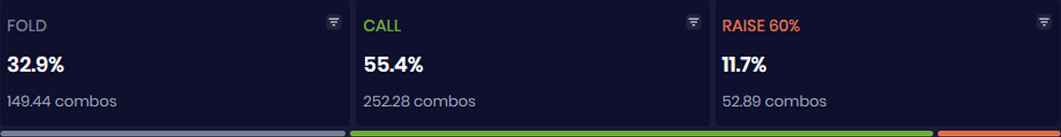
Against this sizing, the Big Blind should call around 55% of the time and check-raise approximately 11.7%.
At this point, you can look at particular boards, especially the ones you find most challenging to navigate, study them in more depth, and learn how to play them more effectively. You can also change and node-lock strategies on any board to better mimic your average opponent.
Instead of diving into specific boards just yet, we can go one step further and make another simplifying assumption. What if the OOP player checks 100% of the time, while the IP player simplifies their strategy to either checking back or c-betting for one-third of the pot? How do the optimal responses change for both players?
In this simplified setup, the overall betting frequency remains remarkably similar at 74.4%.
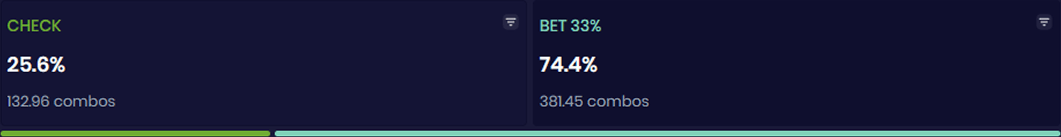
More importantly, this simplification comes at virtually no cost in EV. Whether the IP player splits their betting frequency between three sizes (33%, 75%, and 160% pot) or uses only a one-third-pot bet alongside checks, the EV remains nearly identical at approximately 3.2 BB in a 5 BB pot. In practice, the simplified strategy is substantially easier to execute while retaining almost all of the value of the more complex solution.
How does the OOP player respond when the IP player uses only checks and 1/3-pot bets?
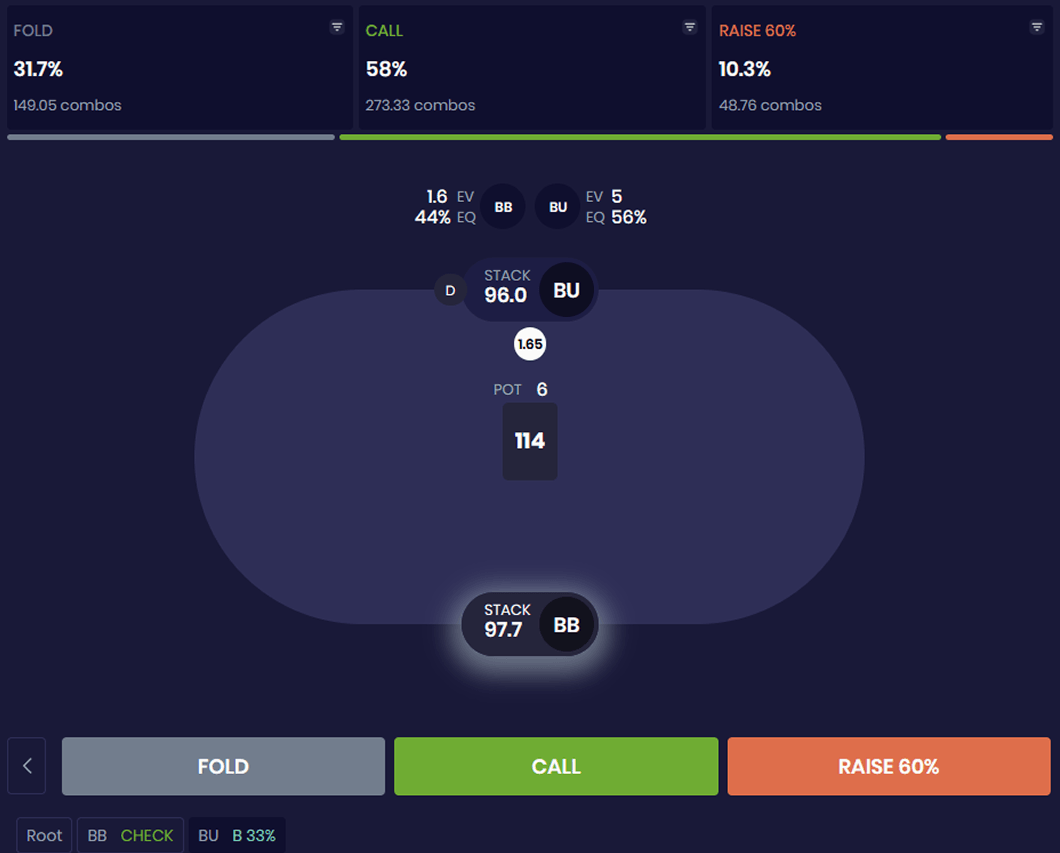
As you can see, the OOP player's overall response to a one-third-pot continuation bet does not change significantly, regardless of whether the IP player uses multiple bet sizes or relies solely on a one-third-pot bet.
This is valuable information. Even if you are unsure how sophisticated your opponent's strategy is, a solid understanding of how to defend against small c-bets will remain effective in both scenarios.
The Practical Implications
Once you understand the strategic incentives for both players, you can go a step further and explore the report in greater depth. For example, you can investigate which board textures allow you to c-bet more frequently than theory suggests, or where you can attack your opponent's c-bets more aggressively than the GTO baseline.
This is where node-locking becomes particularly valuable. It allows you to adjust the solver's assumptions to better reflect what actually happens in your games. Since real opponents almost never play exactly like the solver, you can modify strategies on specific boards and node-lock them to better represent your player pool or even particular player types.
That, however, is a topic for another article.
For now, let's summarize what we can learn from our example by returning to our initial questions.
Should the OOP player ever include leading in their strategy?
There are some boards where leading should be included, but they occur so infrequently that most players can safely omit it from their game plan.
What is the preferred sizing for the IP player according to the GTO strategy?
In this scenario, Deepsolver prefers the one-third-pot bet over the three-quarter-pot sizing and the overbet. However, if we restrict the solver to checking and a one-third-pot bet only, both the overall betting frequency and the EV of the strategy remain very similar.
How should the OOP player react both to the optimal strategy and to strategies that are more likely to reflect real opponents?
Whether your opponent mixes multiple bet sizes or relies primarily on a small c-bet, your response to the one-third-pot bet — and particularly your check-raising frequency — should remain broadly similar.

These are only a foundation for further study, but they provide an excellent starting point. Aggregate Reports are designed to quickly give you an overview of what your baseline approach should look like and help you identify areas that deserve deeper analysis.
To access Aggregate Reports and all other Deepsolver features, take a look at our membership plans.